TDM 10200: Project 14 — Spring 2023
Motivation: As the last project of the semester, lets take a moment and do something that caters to those that have a bit more of a creative artsy side. Data is fun, and data visualizations are a great way to include our creativity. Last project we did a word cloud. This project we are going to do a word cloud but we are going to change the way it is shown.
Scope: python, nltk, wordcloud, matplotlib.pyplot, numpy, PIL
Dataset(s)
When launching Juypter Notebook on Anvil you will need to use 4 cores.
The following questions will use the following dataset(s):
/anvil/projects/tdm/data/icecream
/anvil/projects/tdm/data/icecream/icecream.png
/anvil/projects/tdm/data/icecream/products.csv
/anvil/projects/tdm/data/icecream/reviews.csv
ONE
We are going to look at Ben and Jerry’s product information. There are two CSV files:
-
reviews.csv -
products.csv
Take a look at the head of both of the dataframes, to get familiar with the data in these two files. Then consider:
-
What are the column names for reviews.csv? What are the column names for products.csv?
-
What column do they have in common?
-
Go ahead and merge these two data frames based on the common column (do not merge on a column that has
NaN), and save the results from the merge as a new dataframe. -
Find a second way to merge the data frames.
Helpful Hint
(pd.merge(df1, df2, on='column'))-
Code used to solve this problem.
-
Output from running the code.
-
Answer to questions a,b,c,d
TWO
Now that we have merged the two dataframes, let’s take a look at the columns again.
-
What do you notice about the column ingredients that was originally in the products dataframe? Why do you think this happened?
-
What happens and why if you tried to merge the dataframes on the column ingredients?
-
What should we do instead, if we want to merge on ingredients?
-
Code used to solve this problem.
-
Output from running the code.
-
Answers to a,b,c
THREE
Let’s create a word cloud with the ingredients in all of the Ben and Jerry icecream. Remove all the stop words. Afterwards, we want to focus on the words that appear most frequently. Go ahead and play with the parameters of the WordCloud function. We want you to get comfortable with WordCloud.
Insider Information
-
max_font_size: This argument defines the maximum font size for the biggest word. If none, adjust as image height.
-
max_words: It specifies the maximum number of the word, default is 200.
-
background_color: It set up the background color of the word cloud image, by default the color is defined as black.
-
colormap: using this argument we can change each word color. Matplotlib colormaps provide awesome colors.
-
background_color: It is used for the background color of the word cloud image.
-
width/height: we can change the dimension of the canvas using these arguments. Here we assign width as 3000 and height as 2000.
-
random_state: It will return PIL(python imaging library) color for each word, set as an int value.
Helpful Hint
import matplotlib.pyplot as plt
from wordcloud import WordCloud, ImageColorGenerator
from PIL import Image
import numpy as np
from wordcloud import STOPWORDS

import nltk
from nltk.probability import FreqDist-
Code used to solve this problem.
-
Output from running the code.
-
Answer to the question
FOUR
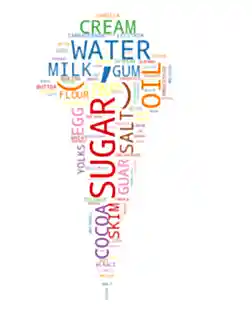
Now for the best part, let’s create a custom shape. The WordCloud function has an argument called mask that enables it to take maskable images and use them as the outline the word cloud we created.
In the dataset there is an image named icecream.png. This image meets the requirement of having a background that is completely white (the color code is #ffffff).
Go ahead and create the word cloud!
What do you see?
Helpful Hint

Insider Information
-
mask: Specify the shape of the word cloud image. By default, it takes a rectangle.
-
Contour_width: This parameter creates an outline of the word cloud mask.
-
Contour_color: Contour_color use for the outline color of the mask image.
Helpful Hint
# Load the image mask
icecream_mask = np.array(Image.open('path'))

# Extract the text to use for the word cloud
text = " ".join(str(each) for each in df.columnname)

# Create a WordCloud object with the mask
wordcloud = WordCloud(max_words=200, colormap='Set1', background_color="white", mask=icecream_mask).generate(text)

# Display the word cloud on top of the image
fig, ax = plt.subplots(figsize=(8, 6))
ax.imshow(wordcloud, interpolation="bilinear")
ax.axis('off')

plt.show()-
Code used to solve this problem.
-
Output from running the code.
-
Answer to the questions
|
Please make sure to double check that your submission is complete, and contains all of your code and output before submitting. If you are on a spotty internet connection, it is recommended to download your submission after submitting it to make sure what you think you submitted, was what you actually submitted. In addition, please review our submission guidelines before submitting your project. |